Imagine you’re planning a road trip across the country. To make the journey smoother and safer, you rely on your GPS. This trusty device provides you with a simple yet powerful tool – the estimated time of arrival (ETA).

Now, think of Forex trading as a similar journey filled with twists and turns, where your goal is to reach your profit destination. To navigate this path effectively, you’ll need a reliable tool, and that’s where Simple Moving Average (SMA) crossovers come in.
Just like your GPS calculates your ETA by smoothing out real-time data, SMAs do something similar in Forex trading. They provide a clear view of market trends, helping you stay on the right route to potential profits. In this comprehensive guide, we’ll not only explore the mechanics of SMAs but also show you how to use them for a successful trading journey. So, fasten your seatbelt, and let’s embark on this exciting Forex adventure together.
Simple Moving Averages (SMAs) are fundamental tools in Forex trading. They provide a smoothed average of an asset’s price over a specified time period, helping you spot trends amidst market noise. SMAs are excellent for beginners because they are easy to calculate and interpret.
In practical terms, let’s consider a chart displaying daily closing prices of a currency pair. SMAs operate by systematically summing up the closing prices over a defined time frame, such as 10 days, and then dividing this sum by the number of days in that period (in this case, 10). This calculation yields a single data point on the chart that signifies the average price over that specific duration.
For example, suppose you have daily closing prices for a currency pair over the last 10 days:
To calculate the 10-period SMA, you sum these closing prices (1.1000 + 1.1020 + 1.1035 + 1.1050 + 1.1080 + 1.1075 + 1.1070 + 1.1065 + 1.1055 + 1.1075 = 11.075) and then divide by 10. The resulting value, approximately 1.1075, represents the 10-period SMA for the current day.
By performing this calculation consistently for each day, you generate a line on your chart. This line effectively smooths out the short-term price fluctuations, making it easier to discern the prevailing market trend. SMAs provide traders with factual data to assess whether the market is trending upward, downward, or trading sideways, offering valuable insights for informed trading decisions.
In Forex trading, Simple Moving Averages (SMAs) are not one-size-fits-all. Traders can choose from various SMA periods, including 10-period, 50-period, and 200-period SMAs. The choice of period determines how quickly the SMA responds to price changes and offers a distinct perspective on market trends.
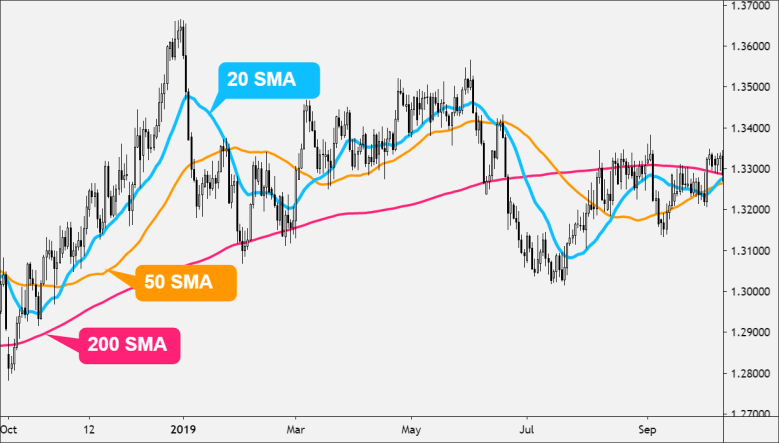
Each SMA period highlights a specific aspect of the market’s behaviour:
Forex traders frequently employ multiple SMAs simultaneously to gain a comprehensive understanding of the market. By plotting different SMAs on their charts, such as 10, 50, and 200-period SMAs, they can visually compare short-term and long-term trends. This approach enhances decision-making by providing a layered perspective:
Comparing these SMAs helps traders make informed decisions, especially when the signals from multiple periods align, strengthening the conviction behind a particular trade. It’s like having a toolkit with different tools for different tasks, ensuring you’re well-equipped to tackle the complexities of the Forex market.
SMA crossovers are a widely embraced trading strategy, known for their simplicity and effectiveness. They revolve around the interaction of two Simple Moving Averages (SMAs) on a price chart, highlighting potential shifts in market trends. This strategy is a cornerstone for traders aiming to seize opportunities at crucial turning points in the market.
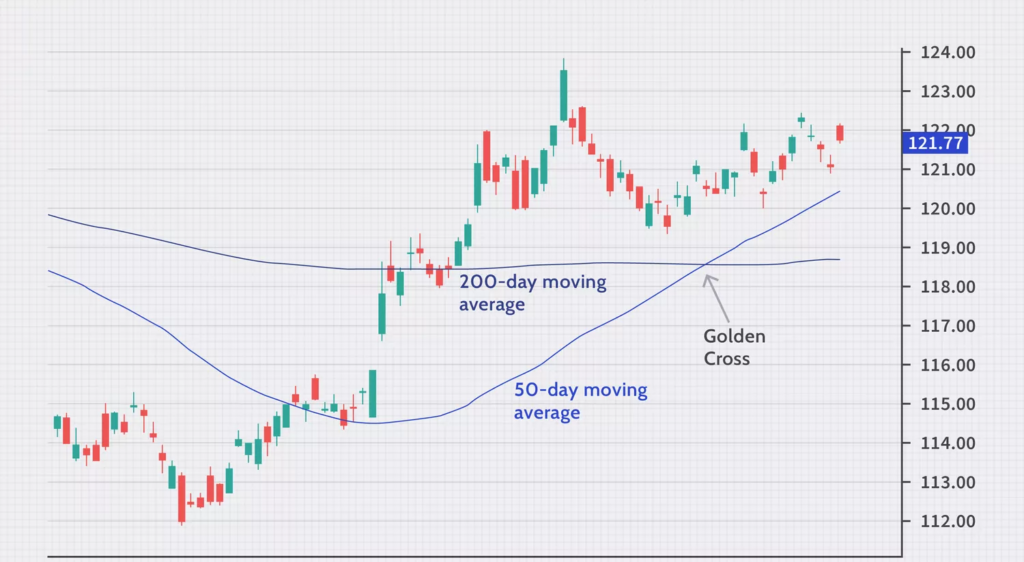
Golden Cross
A Golden Cross is one of the most recognisable and coveted signals in technical analysis. It unfolds when a short-term SMA (typically a 50-period SMA) gracefully glides above a longer-term SMA (usually a 200-period SMA). This event signifies a bullish trend reversal, indicating that the market sentiment is turning positive. It’s akin to a green light for traders, suggesting a potential buying opportunity is on the horizon.
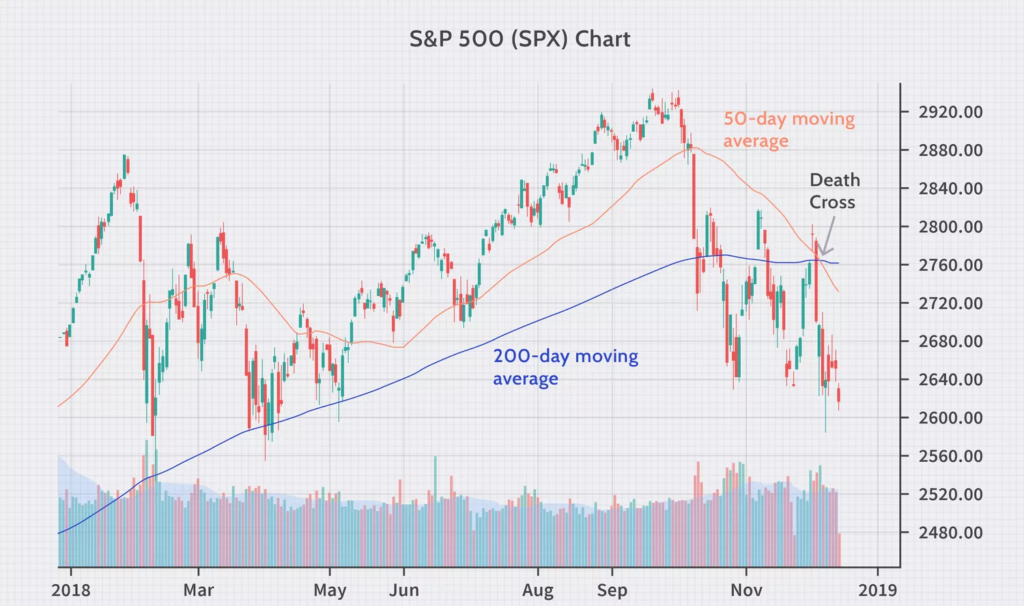
Death Cross
Conversely, the Death Cross is a notable signal for traders looking to profit from bearish market movements. This occurs when the short-term SMA, once again usually the 50-period SMA, crosses beneath the long-term SMA, typically the 200-period SMA. The Death Cross serves as a red flag, indicating a bearish trend reversal and suggesting that market sentiment is turning negative. For traders, this can be an alert to consider selling positions or opening short positions.
In Forex trading, relying solely on Simple Moving Averages (SMAs) may not suffice for effective decision-making. To enhance your trading accuracy and confidence, consider using SMAs in conjunction with other technical indicators. These complementary tools offer a more comprehensive perspective on market trends and potential entry points.
Commonly used indicators for this purpose include:

Using SMA Crossovers for Entry
While SMA crossovers can be powerful signals on their own, it’s crucial to exercise caution and thorough analysis when executing trades. To enter a trade based on a Golden Cross (50-period SMA crossing above the 200-period SMA), consider the following steps:
In conclusion, Simple Moving Average crossovers provide a straightforward and effective strategy for beginners in Forex trading. Their simplicity makes them an ideal starting point for those new to the market. Remember to trade cautiously, continuously learn, and never stop exploring new strategies.
![]()
Follow us on:


