Breakout trading is akin to uncovering hidden gems in the Forex market. Picture yourself as an archaeologist searching for buried treasures in ancient ruins. You patiently excavate layer by layer until you stumble upon a magnificent artifact.
Similarly, breakout traders patiently analyse price charts, searching for key levels where the market may unleash its hidden potential. These breakthrough moments, known as breakouts, serve as signals for traders to enter the market and unearth potential profits.
Imagine you’re observing the GBP/JPY currency pair, and you notice a triangular pattern forming on the price chart. The upper trendline connects the highs, while the lower trendline links the ascending lows. This pattern resembles a coiled spring, hinting at an imminent breakout.
As you continue to monitor the market, suddenly, the price bursts through the upper trendline with conviction, accompanied by a surge in trading volume. This breakout signifies a potential shift in market sentiment and an opportunity to capitalise on the upswing. Recognising this bullish breakout, you enter a long position, embarking on an expedition for profits.
In the following days, the price climbs steadily, reaching new heights. Your trade sails smoothly, capturing a substantial portion of the market’s hidden treasure. With careful risk management and a keen eye for breakout opportunities, you unearthed profits that were waiting to be discovered.
Understanding Breakout Trading Technique
Breakout trading, in simple terms, is a strategy used to capitalise on significant price movements that occur when the price “breaks out” of a defined range or pattern. It involves identifying key levels of support and resistance on price charts and waiting for the price to break above or below those levels with conviction.
Breakout traders aim to enter the market at the early stages of a breakout, anticipating that the price will continue to move strongly in the direction of the breakout, allowing them to capture potential profits.
Common Breakout Patterns
Breakout patterns are essential tools for breakout traders, providing valuable insights into potential trading opportunities. Let’s explore three popular breakout patterns: rectangles, triangles, and channels.
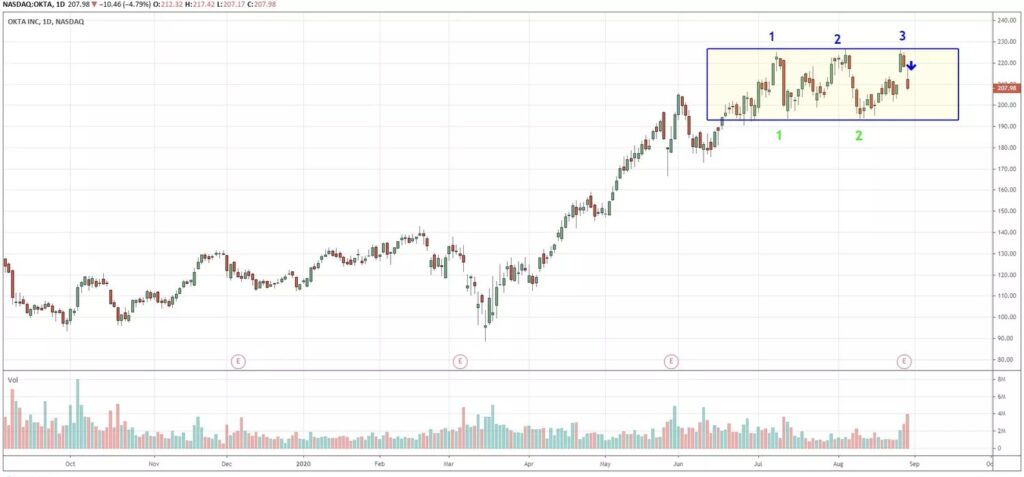
source: TradingView
Rectangles are formed when the price consolidates within a horizontal range, creating a clear support and resistance level. A breakout occurs when the price breaks above the resistance or below the support. Traders interpret a breakout from a rectangle pattern as a signal for potential trend continuation.
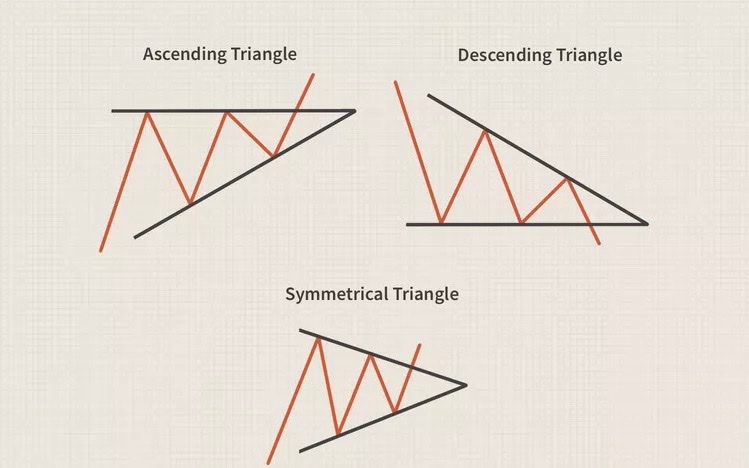
Triangles are characterised by converging trendlines, forming either ascending, descending, or symmetrical patterns. As the price nears the apex of the triangle, the breakout is anticipated. Traders often look for a surge in volume as confirmation before entering a trade based on the breakout direction.
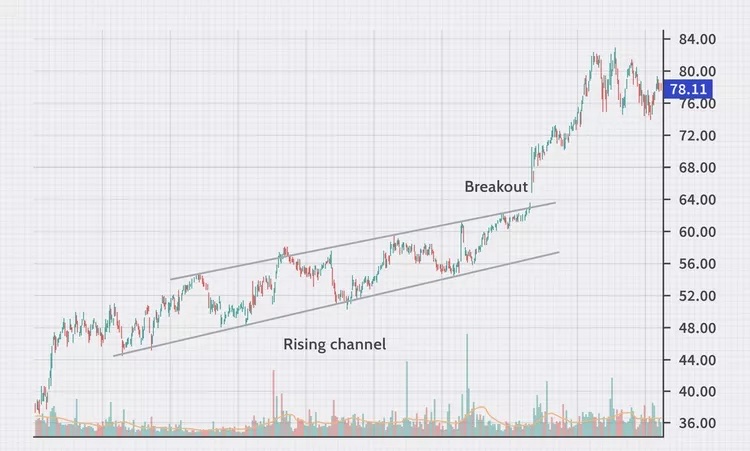
Channels are formed when the price oscillates between parallel trendlines, creating an upward or downward sloping channel. Breakouts can occur when the price breaches the upper or lower trendline, indicating a potential change in the trend direction.
Technical Indicators for Breakout Trading
These indicators act as valuable tools to guide your decision-making process and increase your trading success.
Bollinger Bands: One popular indicator used in breakout trading is Bollinger Bands. They consist of three lines: a middle moving average line and upper and lower bands that represent the standard deviations of price. Bollinger Bands help identify periods of high or low volatility. When the price reaches the outer bands, it suggests potential overbought or oversold conditions. A breakout occurs when the price breaks above the upper band or below the lower band, indicating a potential trend continuation or reversal.
Moving Averages: Moving averages are widely used in technical analysis and can be invaluable in Breakout trading. They smooth out price data over a specified period, providing a visual representation of the average price. Traders often use moving averages to identify the overall trend. In Breakout trading, a breakout occurs when the price crosses above or below a moving average, indicating a potential shift in market sentiment. Commonly used moving averages include the simple moving average (SMA) and the exponential moving average (EMA).
Relative Strength Index (RSI): The Relative Strength Index (RSI) is a popular momentum oscillator that measures the speed and change of price movements. It ranges from 0 to 100, with readings above 70 indicating overbought conditions and readings below 30 suggesting oversold conditions. The RSI can be a valuable tool for breakout traders. Divergences between the RSI and price action can indicate potential breakouts, while overbought or oversold signals can confirm the strength of a breakout.
When using technical indicators, it’s essential to select and implement them based on your trading preferences and market conditions. Experiment with different combinations and parameter settings to find the indicators that best complement your Breakout trading strategy.
Identifying False Breakouts
False breakouts can be frustrating for traders, leading to losses or missed opportunities. It’s crucial to understand how to recognise and filter out these false signals. Here are some tips to help you avoid falling into the false breakout trap:
Wait for Confirmation: Instead of jumping into a trade as soon as a breakout occurs, exercise patience and wait for confirmation. Look for a decisive breakout with strong volume and follow-through price action before considering it a valid signal. This confirmation helps filter out false breakouts and increases the probability of success.
Use Multiple Timeframes: Analyse breakout signals on multiple timeframes to gain a comprehensive perspective. A breakout may appear valid on a lower timeframe but fail to hold on higher timeframes. By aligning breakout signals across different timeframes, you increase the reliability of the breakout.
Consider Support and Resistance Levels: Evaluate the strength of support and resistance levels surrounding the breakout area. Robust support or resistance levels are more likely to produce genuine breakouts, while weaker levels may lead to false signals. Additionally, consider the presence of other technical factors such as trendlines or chart patterns that support the breakout.
Utilise Candlestick Patterns: Pay attention to candlestick patterns around the breakout area. Engulfing patterns, doji formations, or strong bullish/bearish candlesticks can provide additional confirmation of a genuine breakout. These patterns indicate shifts in market sentiment and validate the breakout signal.
Monitor Volume: Volume analysis is a powerful tool for breakout traders. Higher trading volume during a breakout suggests stronger market participation and increases the reliability of the breakout. Conversely, low volume during a breakout may indicate a lack of conviction, potentially signalling a false breakout.
Pros and Cons of Breakout Trading Technique
Breakout trading technique has its own set of advantages and challenges. Let’s dive into the pros and cons of this approach.
Abundance of trading opportunities: Breakout trading provides various setups across different timeframes.
Clear entry and exit signals: Breakout trading offers precise entry and exit points.
Trend confirmation: Breakouts confirm new trends, increasing trading accuracy.
Cons:
False breakouts and whipsaw movements: False breakouts and sudden reversals can lead to losses.
Volatile market conditions: High volatility can result in larger price swings and more false breakouts.
Timing and patience: Breakout trading requires careful timing and patience.
Risk management: Proper risk management is crucial in breakout trading.
In conclusion, Breakout trading technique offers non-professional traders a powerful approach to capture significant price movements in Forex. With profit potential, abundant trading opportunities, and clear signals, it is a rewarding strategy. However, challenges include false breakouts and market volatility. By filtering effectively, exercising patience, and managing risk, traders can navigate these challenges and unlock breakout trading’s potential. Continuous learning and experience are key to mastering this technique and achieving success in Forex. Happy trading!
Summary:
Breakout trading involves capitalising on significant price movements by identifying key levels of support and resistance and waiting for the price to break above or below those levels.
Common breakout patterns include rectangles, triangles, and channels, each indicating potential trend continuation or reversal.
Technical indicators such as Bollinger Bands, moving averages, and the Relative Strength Index (RSI) can be useful for breakout traders to identify potential breakouts and confirm their strength.
False breakouts can be avoided by waiting for confirmation, analysing multiple timeframes, considering support and resistance levels, observing candlestick patterns, and monitoring volume.
Pros of breakout trading include profit potential, abundant trading opportunities, clear entry and exit signals, and trend confirmation. Cons include false breakouts, volatile market conditions, timing and patience requirements, and the need for proper risk management.