Imagine you’re a trader sitting in front of your computer screen, eagerly observing the Forex market unfold. Suddenly, you spot a currency pair showing signs of a potential breakout on the 15-minute chart. Your excitement builds, and you decide to enter a trade, anticipating quick profits. However, as the minutes tick by, the price fails to gain momentum and starts moving against you. Frustration sets in as you realise that your promising trade has turned into a loss.
Now, imagine if you had the ability to zoom out and see the bigger picture. What if you could analyse the same currency pair on higher time frames, such as the 4-hour or daily charts, before making your trading decision? That’s where Multiple Time Frame Analysis (MTFA) comes into play. By incorporating MTFA into your trading strategy, you gain a panoramic view of the market, allowing you to make more informed decisions and unlock a world of profitable trading opportunities.
Multiple Time Frame Analysis involves examining price data across different time frames, ranging from shorter to longer durations. By doing so, traders gain a comprehensive view of the market, helping them identify trends, price patterns, and potential trading opportunities more effectively.
Whether you’re a beginner or an experienced trader, incorporating MTFA into your trading strategy can greatly enhance your decision-making process and increase the likelihood of consistent profitability.
Market Reversals
One of the valuable applications of Multiple Time Frame Analysis lies in identifying potential market reversals. Suppose you observe a pattern on a shorter time frame chart that hints at a reversal. By employing MTFA, you can seek confirmation by examining higher time frame charts. This confirmation serves to validate the reversal and reduces the risk of entering prematurely.
For example, imagine you spot a bullish engulfing pattern on a 1-hour chart, indicating a potential upward reversal. To solidify the validity of this pattern, expand your analysis to a 4-hour or daily chart. If the bullish engulfing pattern aligns with a bullish trend or a key support level on the higher time frame, it strengthens the case for a reversal. This alignment increases the probability of a successful trade, instilling confidence in your decision-making.
Trend Continuation
Another valuable aspect of MTFA is its ability to identify opportunities for trend continuation. By analysing multiple time frames, traders can assess whether a trend is likely to persist or lose momentum.
Consider identifying an uptrend on a 30-minute chart, characterised by higher highs and higher lows. To gain a comprehensive understanding of the trend’s strength, venture into higher time frames such as the 4-hour or daily chart. Analyse the overall trend direction and pinpoint significant resistance levels. If the higher time frame confirms the presence of an intact uptrend and indicates that the price is approaching a major resistance level, it suggests that the trend may continue. Based on this information, you can consider holding onto your trade or adjusting your profit targets accordingly, capitalising on the trend’s momentum.
Breakout Trading
MTFA proves to be particularly valuable when engaging in breakout trading strategies. Breakouts involve capitalising on significant price movements beyond key support or resistance levels. By incorporating MTFA, traders gain a broader context for assessing the strength and potential success of a breakout.
Imagine monitoring a consolidation phase on a 1-hour chart, where the price is confined within a range. To grasp the breakout’s potential, extend your analysis to higher time frames such as the 4-hour or daily chart. This broader perspective enables you to identify critical support and resistance levels that may influence the breakout. If the breakout aligns with these levels and is confirmed by higher time frame price action, it enhances the credibility of the breakout. This confirmation validates the trading opportunity and provides a solid foundation for executing the trade effectively.
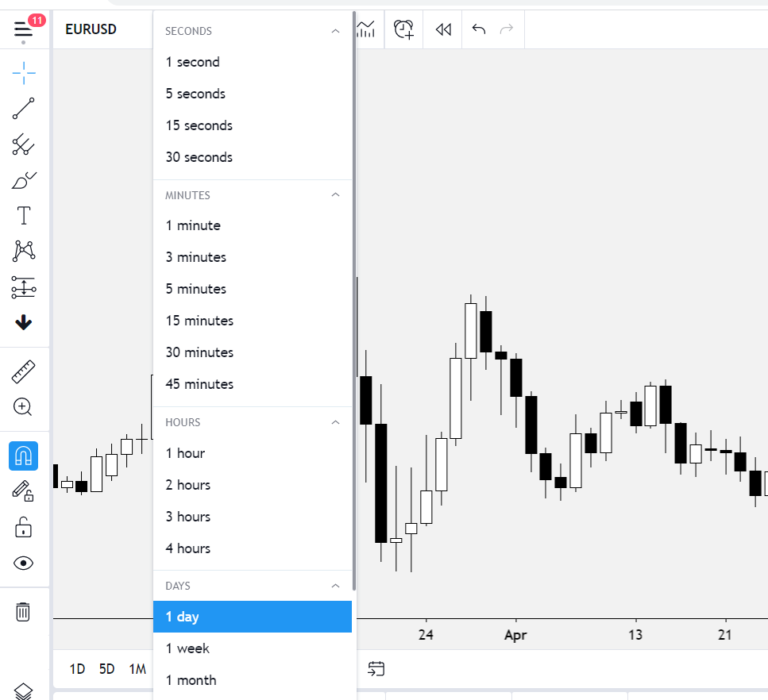
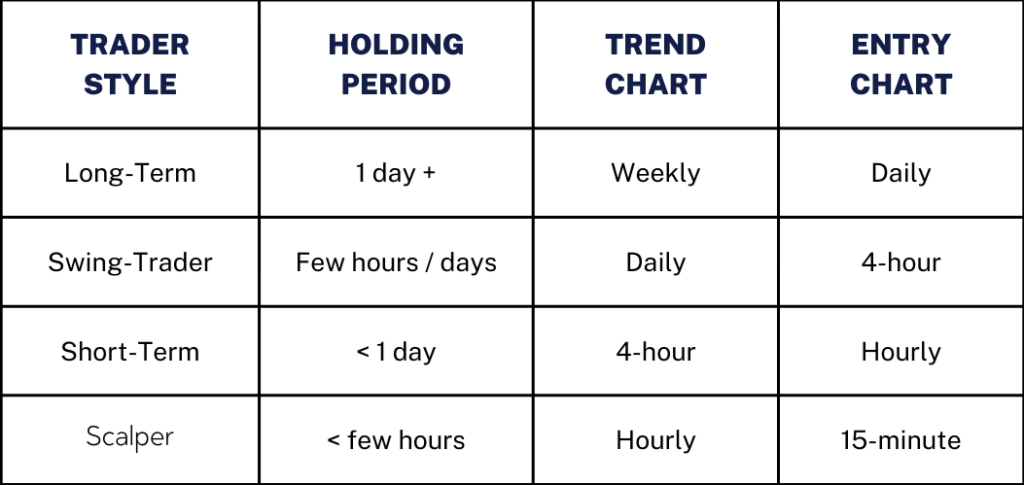
Time Frame Selection
When utilizing MTFA, selecting the appropriate time frames is crucial. It depends on your trading style, goals, and the market segments you’re focusing on.
Remember, the key is to align the time frames in a way that provides a comprehensive view while considering your trading objectives.
MTFA Trade Execution
Executing trades based on MTFA requires a structured approach. Here are some guidelines to follow:
Once you have a solid understanding of MTFA, you can explore advanced techniques that further enhance your trading analysis. These may include multiple currency analysis, intermarket analysis (examining the relationships between different markets like stocks and currencies), or identifying harmonic patterns for precise entry points.
It is important for traders to weigh the advantages and disadvantages of MTFA and consider their individual trading style and preferences before incorporating it into their strategy.
Pros:
Cons:

To maximise the effectiveness of MTFA, consider the following tips:
In conclusion, Multiple Time Frame Analysis is a powerful technique that equips traders with a comprehensive understanding of the Forex market. By analysing price data across different time frames, traders can identify trends, confirm signals, manage risk, and seize profitable trading opportunities.
Remember, the key to successful MTFA lies in selecting the appropriate time frames, combining technical indicators, considering market correlations, and executing trades with discipline and precision. With practice, patience, and a structured approach, MTFA can become a valuable tool in your Forex trading arsenal, leading you towards consistent profitability.
![]()
Follow us on:


