Imagine you’re an art enthusiast visiting a museum, marvelling at a famous painting by Leonardo da Vinci, the “Mona Lisa.” As you stand in awe, you notice something intriguing. The proportions and composition of the painting seem to follow a captivating pattern — a pattern known as the Fibonacci sequence.
This sequence not only captivates artists and mathematicians but also holds significant value in the world of Forex trading. In this article, we will explore the concept of Fibonacci retracement, a technique that utilises this sequence to identify potential support and resistance levels in trading.

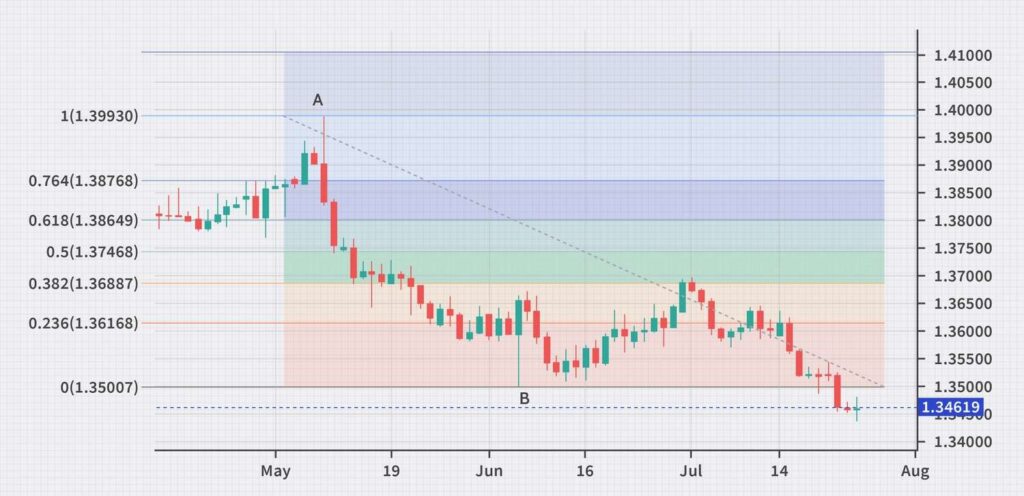
Fibonacci retracement is a technical analysis tool used by traders to identify potential levels of support and resistance in financial markets. It is based on the Fibonacci sequence, where each number is the sum of the two preceding ones (1, 1, 2, 3, 5, 8, and so on).
The key idea behind Fibonacci retracement is that after a significant price movement, the market often retraces or “pulls back” before continuing in the original direction.
To understand Fibonacci retracement, let’s imagine a scenario where a market is in an uptrend, meaning the price is moving upward. During this uptrend, the market experiences pullbacks or temporary reversals before resuming the upward movement.
Fibonacci retracement helps traders identify levels where these pullbacks are likely to end, potentially presenting opportunities for entering trades in the direction of the overall trend.
Fibonacci retracement levels are represented by horizontal lines on a price chart. These levels correspond to key percentages derived from the Fibonacci sequence, such as 23.6%, 38.2%, 50%, 61.8%, and 78.6%.

By drawing these lines between significant swing highs and lows, traders can identify potential areas of support (in uptrends) or resistance (in downtrends) where the price may reverse or consolidate.
Fibonacci retracement levels act as guidelines for traders to anticipate areas of support or resistance. For example, if a market is in an uptrend, traders may look for opportunities to buy near the Fibonacci retracement levels, expecting the price to bounce back from these levels and continue its upward movement. Similarly, in a downtrend, traders might seek opportunities to sell near the Fibonacci retracement levels, anticipating the price to reverse lower.
Recognising market trends and reversals
Fibonacci retracement is particularly useful in identifying market trends and potential reversals. By applying the tool to a trending market, traders can gain insights into the levels at which the price may reverse and continue its trend.
Suppose the price of a currency pair has been steadily rising. By applying Fibonacci retracement, a trader may find that the price tends to retrace to the 61.8% level before continuing its upward movement. This retracement level can serve as a potential buying opportunity for the trader.
Identifying entry and exit points
Fibonacci retracement levels can assist traders in determining optimal entry and exit points for their trades. By combining these levels with other technical analysis tools and indicators, traders can increase the probability of successful trades.
If a trader identifies a bullish trend and notices that the price is approaching a Fibonacci retracement level, such as 38.2%, it can be a potential entry point to buy the currency pair. Conversely, if the price reaches a Fibonacci retracement level during a bearish trend, it may serve as an exit point for a short position.
Determining stop-loss and take-profit levels
Fibonacci retracement levels can also be used to set stop-loss and take-profit levels. Traders often place stop-loss orders below support levels in uptrends or above resistance levels in downtrends to limit potential losses. Take-profit levels, on the other hand, can be set at levels where the price is expected to encounter resistance or support.
Step 1: Identify a significant swing high and low
Locate two points on the price chart that represent significant price reversals. These points will serve as the swing high and swing low for plotting the Fibonacci retracement levels.
Step 2: Plot Fibonacci retracement levels
Draw horizontal lines corresponding to the Fibonacci retracement levels between the swing high and low. Most trading platforms offer built-in tools for conveniently plotting these levels.
Step 3: Analyse price action around Fibonacci levels
Observe how the price reacts to the Fibonacci retracement levels. Look for signs of reversal, such as candlestick patterns or a shift in momentum, as confirmation of potential trading opportunities.
Step 4: Determine potential entry, exit, stop-loss, and take-profit levels
Based on the analysis of price action around Fibonacci retracement levels, decide on appropriate entry and exit points for your trades. Set stop-loss and take-profit levels to manage risk and capture profits respectively.
In addition to retracement levels, Fibonacci extensions are another useful tool in Forex trading. Extensions project potential price targets beyond the original price movement, aiding traders in identifying levels where the price may encounter significant resistance or support. Common Fibonacci extension levels are 61.8%, 100%, 161.8%, 200%, and 261.8%.
By applying Fibonacci extensions to a price chart, traders can project potential levels where the price may reach after a significant move. These levels can serve as targets for taking profits or adjusting stop-loss orders, aligning with the concept of Fibonacci retracement to guide trading decisions.
Mistake 1: Over-reliance on Fibonacci levels without considering other factors.
While Fibonacci retracement is a valuable tool, it should not be used in isolation. Traders should consider other technical analysis tools, fundamental factors, and overall market context to make well-informed trading decisions.
Mistake 2: Neglecting to adjust Fibonacci levels when market conditions change.
Market conditions can change rapidly, rendering previously drawn Fibonacci levels less relevant. Traders should regularly update and adjust their Fibonacci retracement levels to align with the current price action.
Mistake 3: Placing excessive emphasis on minor Fibonacci levels.
While all Fibonacci retracement levels have their significance, traders should avoid placing excessive emphasis on minor levels that may not consistently influence price behaviour. Prioritising the key levels mentioned earlier can lead to more accurate trading decisions.
Now, let’s weigh the advantages and disadvantages of utilising Fibonacci retracement in Forex trading. By exploring both the pros and cons, we can gain a comprehensive understanding of the benefits and limitations of this powerful tool.
Pros:
Cons:
Tips for Effective Fibonacci Retracement Trading
In conclusion, Fibonacci retracement is a potent technique that uses the Fibonacci sequence to identify support and resistance levels in markets. By applying the concepts and steps outlined in this article, traders can improve their analysis and decision-making. Remember to combine Fibonacci retracement with other tools, consider market context and fundamentals, practice risk management, and continuously refine your skills. With dedication and practice, Fibonacci retracement can become a valuable asset in your trading toolkit.
Summary:
![]()
Follow us on:


